Are suppliers entitled to windfall profits just because their variable costs have increased?
(Part II: Price Productivity Macro Analysis)
In Part I, Price Productivity Macro Analysis showed that an inflationary driven price increase potentially could contain a Windfall Profit for the supplier. The example showed the proposed price increase was reduced by 20%. Using the same example, this post digs deeper and demonstrates how a Price Productivity Micro Analysis produces 63.4% reduction in a proposed price increase. Part I showed how a 10% price increase was countered with an 8% increase. This post shows how the same 10% price increase is countered with a much lower 3.66% increase.
The analysis starts with the notification from the supplier stating: “Our costs increased by 10%, therefore, our price needs to increase by 10%.”
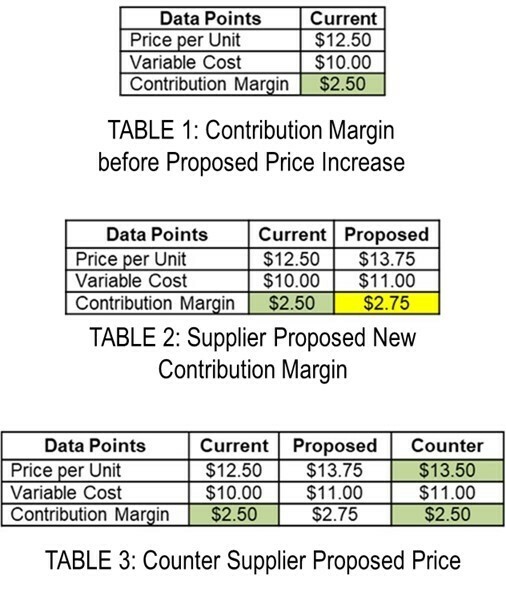
Step 1: With the Unit Price and estimated Variable Costs, the Contribution Margin is calculated using the simple formula:
Unit Price – Variable Costs = Contribution Margin
In our example: $12.50 - $10.00 = $2.50 (Highlighted in Orange below.)
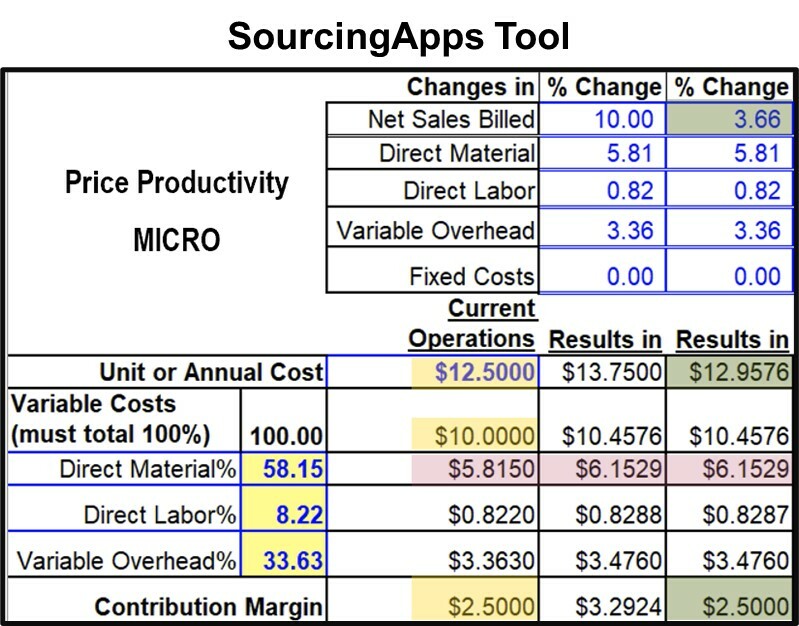
Step 2: Variable Costs are made up of Direct Material, Direct Labor, and Variable Manufacturing Overhead. To determine the impact of increased cost, the procurement professional inquires “What cost changed and by how much?” For this example, the supplier indicates their variable costs have increased by 10%.
Step 3: Determine the percentage breakdown of Direct Material, Direct Labor and Variable Manufacturing Overhead that make up Variable Cost. Using the supplier’s NAICS code, the most recent US Census Bureau Annual Survey of Manufactures and Quarterly Financial Report we can breakdown the percentages as 58.15%, 8.22% and 33.65% respectively. (Highlighted in Yellow below.)
Step 4: Calculate a 10% price increase for each of the Variable Costs. (Highlighted in Red below.)
Step 5: Find the price increase percent that maintains the Contribution Margin at $2.50. As shown in the chart below in green highlight, a price increase of 3.66% will cover the 10% increase in Variable Costs while avoiding a Windfall Profit for the supplier. The buyer counters the proposed price increase with an evidence-based $12.9576 offer and the negotiation begins.
A procurement professional can perform the above steps in as little as 10 minutes. How many price increases were accepted over the last two years without an evidence-based challenge?
This example used the Price Productivity Micro worksheet found in the Cost Analysis section of Souring Apps (currently not available to new subscribers). Once the NAICS was identified, the Price Productivity Calculator extracted information from the Sourcing Apps data base to calculated Step 3. The NAICS used in this example was 31-33 Manufacturing. The data base contains 648 NAICS codes and 13 years of US Census data.
Sourcing is for Convergent Thinkers!